Webassembly Without The Browser Part 2
In part 1 we have learned how to set up WebAssembly VM to run a simple rust program that can add two numbers and print the result to stdout. In part 2 we will go over Debugging and Binary size.
Debugging
Debugging is one of the rough edges of WebAssembly. To understand why this is a rough edge, we must first have a high-level understanding on how a WebAssembly VM works. We can split them into two categories: WASM VMs with JIT and WASM VMs without JIT. Right now, debugging is possible only for JIT-enabled VM e.g.: Wasmtime.
JIT is the key functionality that they use to enable a seamless debugging experience between the host program (the one that uses the VM) and the WebAssembly program. We usually use GDB or LLDB to debug the host programs. For example, to make this work, Wasmtime generates the JIT code, then it patches the debug info for the rust WebAssembly binary and calls a magical function named: __jit_debug_register_code. After this function is intercepted by GDB/LLDB and the JITed WebAssembly code can be debugged in the same session as the host program. It tells LLDB that this JIT-generated code has that patched debug information. Pretty neat!
In order for us to debug WebAssembly, there are a few key steps that we have to take:
- Use Visual Studio Code as our IDE (makes step 2 and 3 possible).
- Install CodeLLDB plugin for VSCode. Other GDB/LLDB plugins are fine but this good on Linux/OSX/Windows too.
- Tell Wasmtime to emit debug information. We use the configuration object (full program can be found in part 1 of this series):
let engine = Engine::new(Config::new().debug_info(true)); - Set up Visual Studio Code
launch.jsonas if you’d be debugging the host program. For example:"configurations": [ { "name": "Debug WASM", "type": "lldb", "request": "launch", "program": "${workspaceFolder}/target/debug/wasm_host.exe", "cwd": "${workspaceFolder}", "args": [], } ]
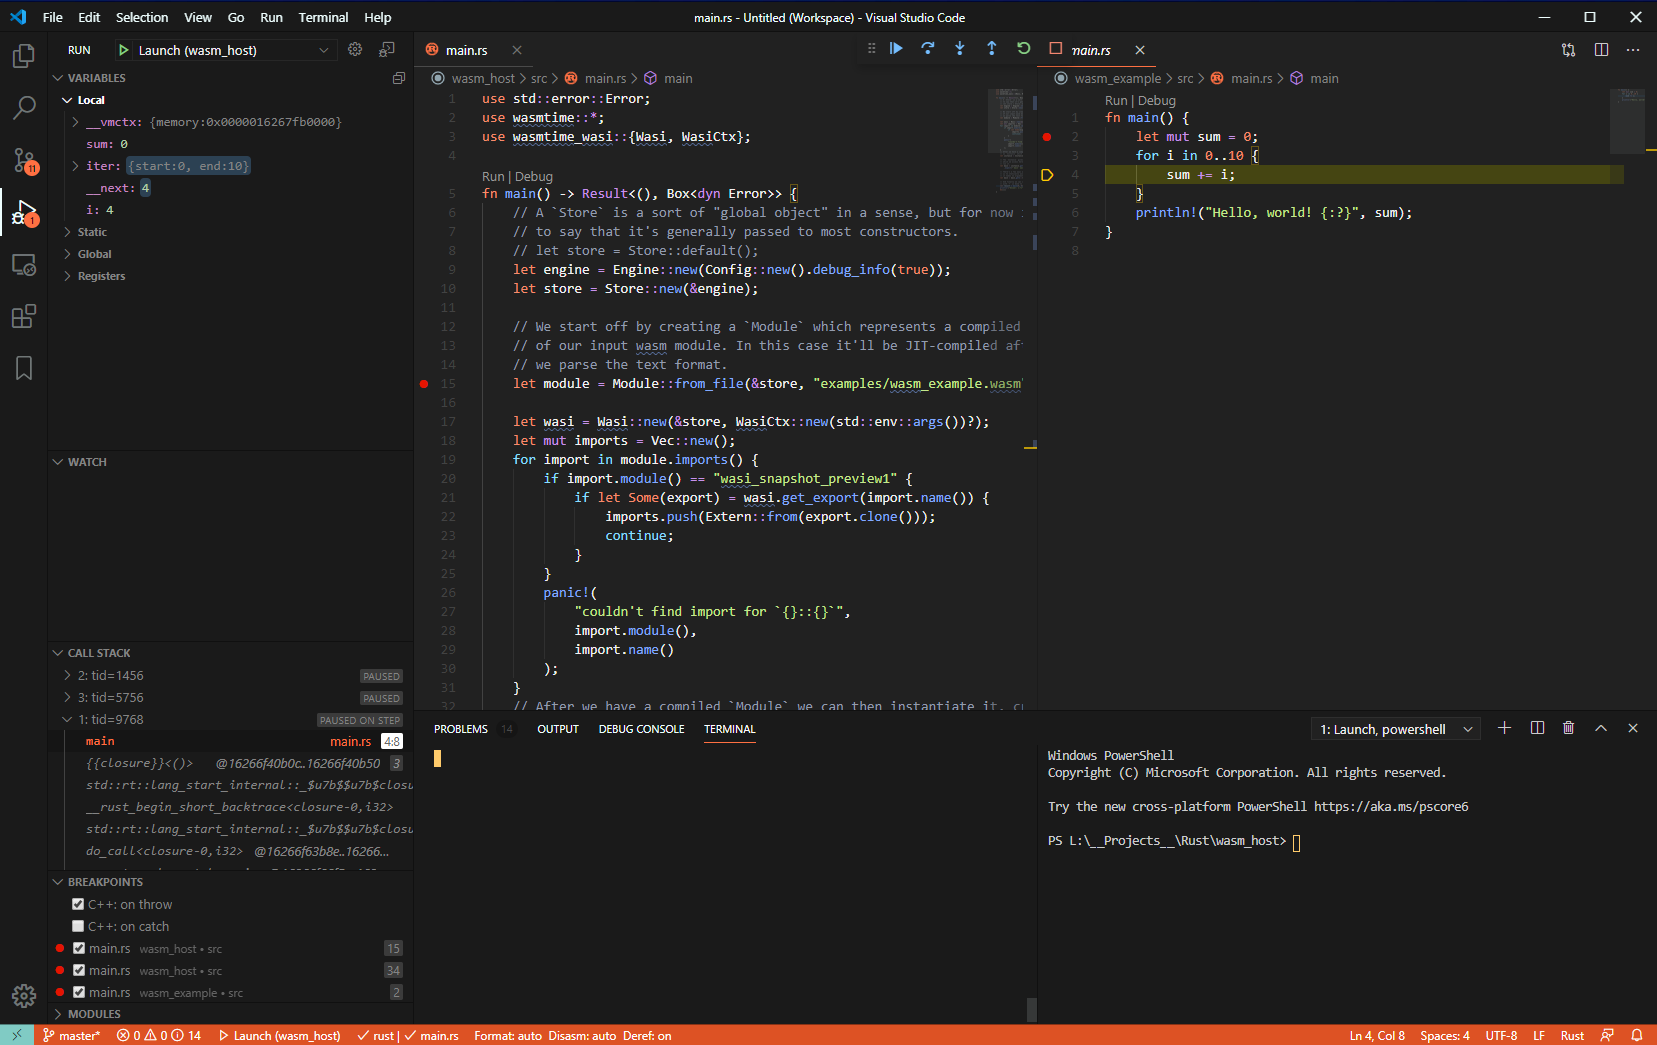
Here is a screenshot of me debugging a WebAssembly program (on the right) and the host VM (on the left). As you can observe, the local variables are listed as expected and call stacks work just fine.

If you’re deploying software to a place where a JIT-only VM can’t go, you’re stuck maintaining two VMs in your host program: one you’re using for debug purposes and one that actually ships to the platform you’re interested in. I expect that with time more VMs that include debug protocols and more debuggers will appear. Maybe they will use simpler protocols that don’t require gdb server to be present on the target platform in order to remotely debug and inspect some code, and just require the VM to be built with a debugger-enabled compile option.
Binary size
One of the neat tricks you can do with WebAssembly is update your programs without requiring any native code to be re-deployed on the devices you’re using this on. Other uses involve some sort of compute-at-edge scenarios like Fastly, Cloudflare and others are doing. This is better explained by this video.
In all of the cases above, or places where disk space is a concern, binary size is one dimension we will need to care about when using WebAssembly. This is rough edge number 2.
I do not want this section to turn into a “Here are 10 tips and tricks to optimize software” kind of blog post. The most important thing you can do in order to keep this under control is to monitor the size of your WebAssembly binaries from the start of your project. In doing so, you can find regressions as they happen (e.g. in a CI step) and then proceed to further investigate looking for a fix once your binary size goes above a certain limit.
One advice that I will mention, as it’s generally applicable, is configuring your project to optimize for size and enable LTO. This is done by editing Cargo.toml to include:
[profile.release]
lto = true
opt-level = 's' # or 'z', but may cost performance
Beyond that, here are some tools that will help you push size optimizations further if needed:
- wasm-opt can provide further optimizations (beyond the
opt-level='s'flag). You almost always want to use this. - wasm-snip can be used to remove certain functionality that may be unused. I don’t find it particularly useful as the improvements are not that great (this is it’s a very blunt tool that replaces some methods with
unreachable!). It can be helpful for some use-cases. - twiggy is an excellent tool for finding the top functions that make up for the size of your executable.
- Most articles on WebAssembly size optimization will suggest replacing the default rust allocator with wee_alloc.
Articles that may be helpful: